
 By Zhi Wei and team · 4 min read
01
The number we all quote
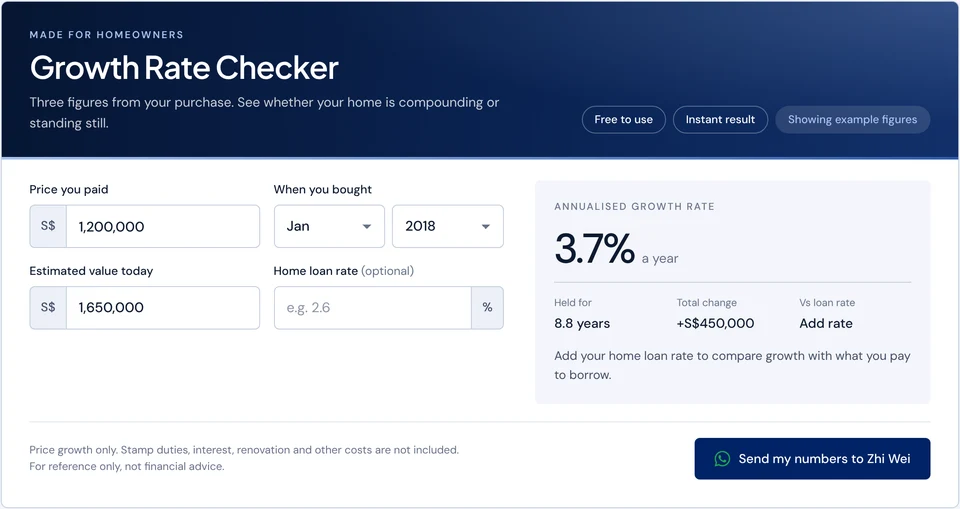
Most of us look up the last transacted price, see it's S$200k more than we paid and think, that's my profit. I do it too. But that number leaves out how long it took. The same S$200k could mean your money grew well, or did no better than a fixed deposit. That's hard to tell in your head, so I built a checker that works out the yearly rate for you.
8.7%
A year, gain over 4 years
3.8%
A year, gain over 9 years
02
Same S$200k, very different stories
| Bought | Price paid | Held for | Yearly growth |
|---|---|---|---|
| Oct 2024 | S$500,000 | 2.0 years | 17.9% |
| Oct 2022 | S$500,000 | 4.0 years | 8.7% |
| Oct 2017 | S$500,000 | 9.0 years | 3.8% |
| Oct 2022 | S$1,000,000 | 4.0 years | 4.6% |
| Oct 2017 | S$1,000,000 | 9.0 years | 2.0% |
Checker results on 18 October 2026. Price growth only.
The longer it took, the lower your yearly rate. Where you started matters too. On a S$1m home, S$200k over nine years is only 2.0% a year. That's below the 2.6% HDB concessionary loan rate.
03
How I work it out
- Enter three figuresThe price you paid, the month you bought, and what you think it's worth today. Your loan rate is optional.
- Count the years heldI count the days from the 1st of your purchase month to today, then divide by 365.25.
- Work out the yearly rateThis is the steady yearly rate that turns what you paid into today's value. You may hear it called CAGR.
- Show the total changeToday's value minus what you paid, in dollars.
- Compare with your loan rateI show the gap in percentage points, to one decimal place.
What the tool calculates
Annualised growth = (Value today ÷ Price paid) ^ (1 ÷ Years held) − 1
04
I ran it on 242,955 HDB resales
I wanted to see the bigger picture, so I ran the same formula on every HDB resale from January 2017 to October 2026. I compared the median price per sqm in 2017 with the latest 12 months. Price per sqm takes out some of the noise from flats of different sizes.
S$4,282
Median per sqm, 2017
S$6,483
Median per sqm, latest 12 months
4.8%
Growth a year
2026 covers January to October. Source: data.gov.sg.
As you can see, growth doesn't come in a straight line. Prices dipped in 2018 and 2019, jumped in 2021 and have been roughly flat in 2026.
05
When you bought matters a lot
Median price per sqm by year vs Nov 2025 to Oct 2026.
If you bought in 2019 or 2020, you came in just before the big rise, at about 6.7% and 7.1% a year. Bought in 2024? You're at 3.4%, because most of the rise had already happened. Every entry year beat 2.6%, but remember this only looks backwards.
06
What about towns and flat types?
Six fastest and five slowest of 26 towns.
Please don't read this as good towns and bad towns. In the fastest towns, the flats selling today are much newer than the ones sold in 2017. So town medians mix real growth with a change in what's being sold.
Median price per sqm, 2017 vs latest 12 months.
07
How to get an answer you can use
- Use a recent sold price nearby, not the highest asking price you've seen online.
- Use the month your purchase completed.
- Be careful with results under two years. A short gain gets stretched into a yearly rate.
- Check your rate at different points, since growth comes in phases.
- Use the loan rate comparison as a rough guide only.
08
How I checked the numbers
I ran the checker's own code on every scenario here, dated 18 October 2026. You can't enter future dates, losses show as negative rates, and the loan comparison only appears when you enter a rate above zero.
Key takeaways
- A dollar gain means little until you divide it by the years it took.
- HDB median price per sqm grew about 4.8% a year from 2017.
- Your rate depends on when you bought: about 7.1% for 2020, 3.4% for 2024.
- Town rankings partly reflect newer flats, so go by your own figures.
What the tool does not do
- It measures price growth only. Stamp duties, interest, renovation and agent fees aren't included.
- Your result is only as good as your estimate of today's value. Not sure? Ask me for a valuation.
- Holdings under a year still get annualised, so don't read them as a trend.
FAQs
What is an annualised growth rate?
It's the steady yearly rate that turns what you paid into today's value, over the time you've owned the home. You may hear it called CAGR.
How much have HDB resale prices grown each year since 2017?
Median price per sqm rose from S$4,282 in 2017 to S$6,483 in November 2025 to October 2026, about 4.8% a year.
What is the HDB concessionary loan rate now?
It is 2.6% a year, 0.1 percentage points above the CPF Ordinary Account rate of 2.5%. CPF Board confirmed it is unchanged from 1 October to 31 December 2026.
Does the checker include stamp duty and interest costs?
No. It measures price growth only, from what you paid to what you think it's worth today. Stamp duties, interest and renovation aren't included.
Sources (4)
- HDB resale flat prices, data.gov.sg
- CPF Board: interest rates from 1 October to 31 December 2026
- CPF Board: interest rates from 1 April to 30 June 2026
- HDB: housing loan from HDB
For education and illustration only. Figures depend on the inputs and the rules in force at the time of writing, and property values can fall as well as rise. This is not financial advice.