
Working with me
Make your property work harder for you.
Most of us sell when it feels right and buy whatever is available that month. I get it, I've been there too. I'd rather we look at the numbers first. Here is exactly how I work with you to grow your property portfolio, step by step.
Every recommendation I make shows you the numbers behind it, the risks and your way out.
How it works
One process, from review to your next keys.
Growing your portfolio usually means selling one home and buying the next. So I treat it as one plan. We review what you own, plan the next move, then sell and move with every date and dollar mapped.
-
01Review · Check what you own now
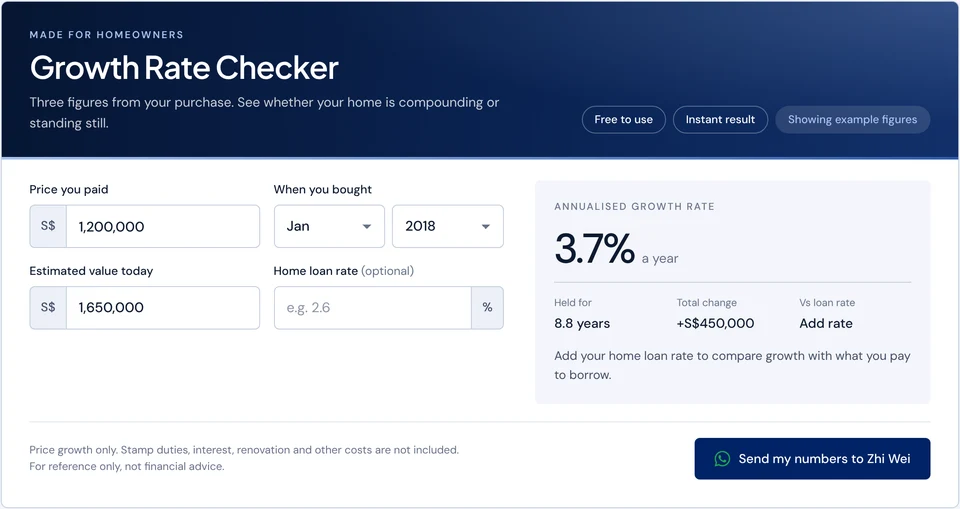
Is your home still growing?
Before we look at anything new, we check how hard your current home has worked each year since you bought. That tells us whether to hold, sell or move the money into something with more room to grow.
- Annual growth since purchase
- Growth compared with borrowing costs
- Your goal: own-stay, growth, rental or a mix
-
02Review · Know your number
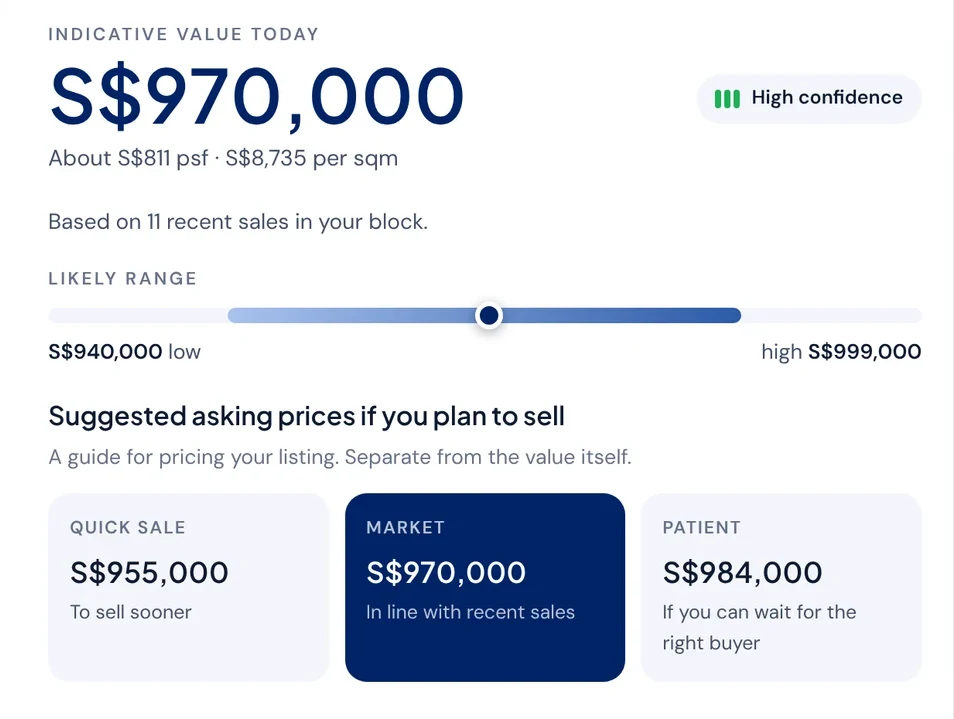
What is your home worth today?
I start with recent sales in your block and street, adjusted for your floor and for today’s prices. HDB flats get an estimate on the spot. Condo and landed homes I value by hand within 24 hours.
- Recent sales nearby, moved to today’s prices
- Estimated value range and confidence
- Every comparable sale shown
-
03Plan · Map the options
Compare every option on one growth map
I place each home you are considering on one map. Across: how its price compares with similar homes nearby. Up: how much room it has to grow, from recent sales, new supply coming and how many buyers trade there.
- Entry price checked against recent sales
- Upcoming supply and resale activity
- Likely future buyers
Example map for illustration. Your map uses the homes you are actually considering. -
04Plan · Test the numbers and the exit
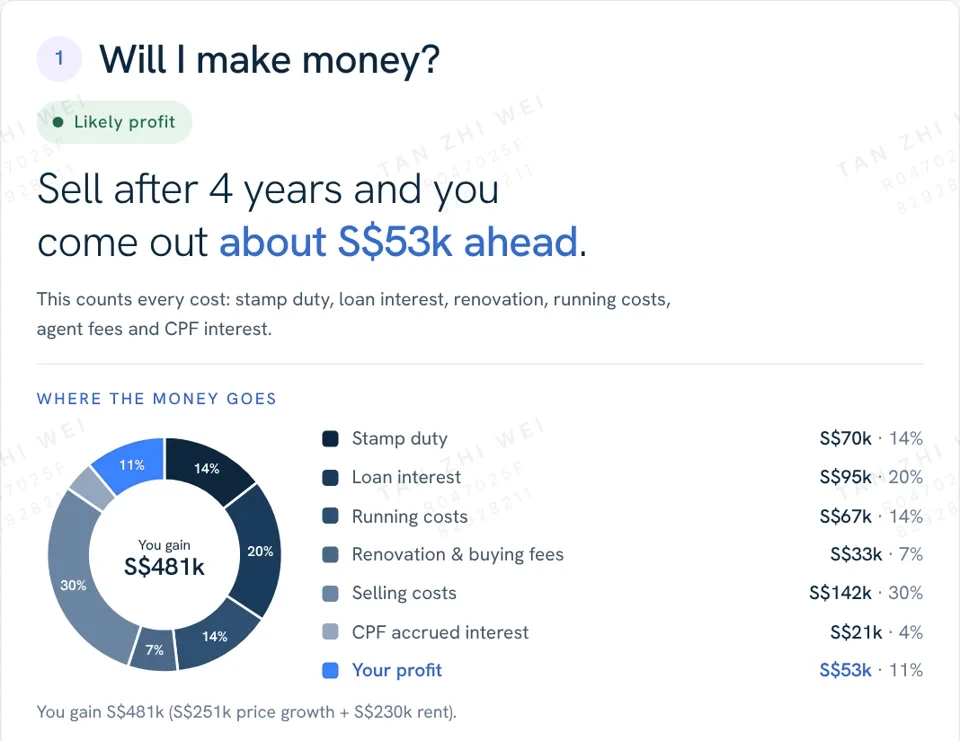
Know your net proceeds and exit plan
Before you commit, we run the full numbers: stamp duty, loan interest, holding costs and what you would keep if you sold after 4, 7 or 10 years. Then we plan your exit: when to sell and where the money goes next, so your property keeps working harder for you.
- Profit after all costs, year by year
- Your break-even selling price
- An exit plan for your next property
-
05Plan · Plan the next home first
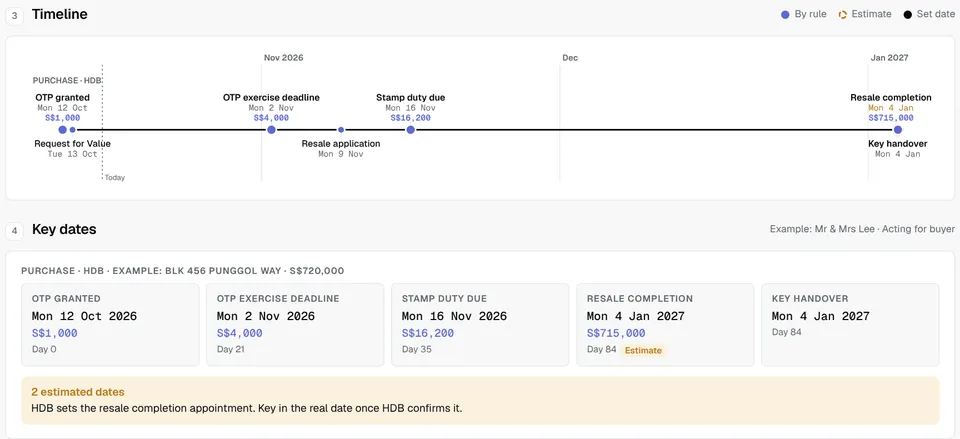
Can you afford the next home if you sell now?
This is where most people get caught. Sell first, and the next home can cost more than planned. So before we list, we check your loan limit, cash and CPF for the next purchase, and map every date from sale to new keys.
- Your net proceeds after all costs
- Whether the next home fits your budget
- All deadlines on one timeline
-
06Sell and move · Price and position
Price with evidence. Reach the right buyer.
We choose the asking price from recent sales and how quickly you need to move. Then we work out who is most likely to buy your home and what they will compare it with, so the listing speaks to them from day one.
- Three price options: quick, market and patient
- Likely buyer and competing homes
- Your listing's first two-week plan
Example asking price plan
Choose the pace that fits your plans
Quick saleS$955,000To sell soonerMarketS$970,000In line with recent salesPatientS$984,000If you can waitLikely buyer: an upgrading family comparing 4-room flats nearby with a longer lease left.
-
07Sell and move · Track and adjust
Track your listing every week
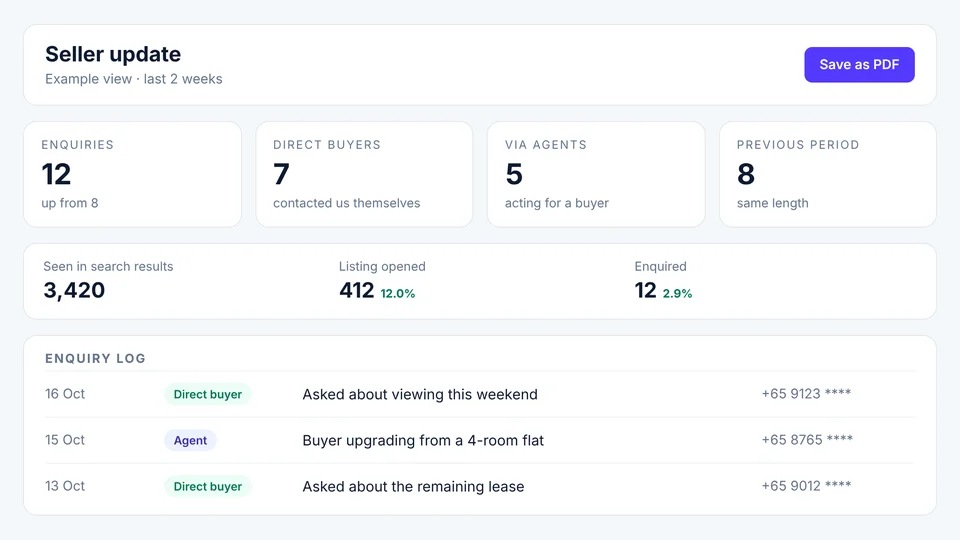
Once you are live, you get a regular update: every enquiry, who it came from and how it compares with the weeks before. If interest slows, we see it early and decide the next step together.
- Every enquiry logged, from buyers or agents
- Views and enquiries versus the previous period
- Clear next steps when results change
What you leave with
Your personalised 5–10-year property plan
A personalised plan of 40+ pages: where you stand today, the options on your growth map, your budget for the next home and the checkpoints along the way.
| A | B | C | D | |
|---|---|---|---|---|
| 1 | Stage | When | What we work out | Your figure |
| 2 | Review | Now | How fast your home has grown | 3.7% a year |
| 3 | Review | Now | What your home is worth today | S$970,000 |
| 4 | Plan | Year 1 | Cash and CPF back after selling | S$612,400 |
| 5 | Plan | Year 1 | Next home budget, without stretching | S$1,550,000 |
| 6 | Move | Year 1 | Days from sale to new keys | 84 days |
| 7 | Review | Year 4 | Hold, or move again? | Checkpoint |
| 8 | Review | Year 7 | Exit plan for the next step | Checkpoint |
The tools behind it
Try the same tools
I use with my clients.
Try most tools yourself; together, we'll apply them to your actual figures.
Ready to see your numbers? Let’s start with a review.
Tell me what you own and where you want to be in 5 to 10 years. I will show you the numbers before you decide anything.
Figures and maps on this page are examples for illustration. They are not a valuation, a forecast or financial advice. Every plan is based on your own figures and the rules in force at the time.