
 By Zhi Wei and team · 4 min read
01
You list it, then it goes quiet
You list your home and then nothing. You start wondering if anyone is looking, or if your agent is still trying. You're not alone. The Ministry of National Development said most complaints about agents were about service quality and unprofessionalism.
2,489
Complaints against agents, 2016 to 2018
About 830
Complaints a year
“Got a few calls this week” sounds fine, but you can't check it. That always bothered me. So I built a page that turns your listing's records into a short written update, with numbers you can hold me to.
02
Your listing, on one private page
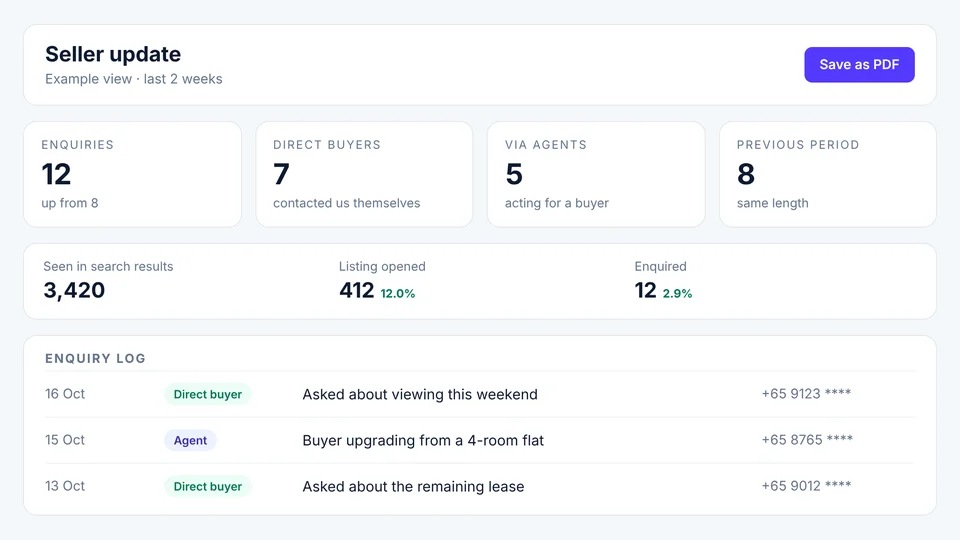
The page is private. You only see your own listing, built from its enquiry records and daily PropertyGuru figures. Enquirers' mobile numbers are partly hidden from you, and the full numbers stay with me.
03
What you'll see each week
| Panel | What it shows |
|---|---|
| Header | Listing, property type, district and dates covered. |
| Written summary | One or two plain sentences on rising, falling or flat interest. |
| Headline figures | Enquiries, direct buyers, agent enquiries and the previous period. |
| Enquiries chart | A bar per day, or per week for longer ranges. |
| PropertyGuru panel | Times seen, listing opens, enquiries and two rates. |
| Notes and enquiry log | Viewing notes, then one row per enquiry. |
Read from the seller page code.
04
This week against last, always like with like
Every number is compared with the period just before it, of exactly the same length. Press Latest 2 weeks and you see 14 days against the 14 days before. So you're never comparing a good fortnight with a slow month.
Comparison window
Days in period = (end date − start date) + 1.
New listings are handled carefully. If there are no earlier records, the page simply tells you there's nothing to compare yet. If the earlier period is only partly covered, the summary adds a note.
05
How the summary decides what to tell you
The summary follows fixed rules, so the same numbers always give the same words. I can't dress it up, and neither can anyone else. Let X be the enquiries this period and Y the enquiries in the period before.
| Condition | What the summary says |
|---|---|
| X = 0 and Y = 0 | No enquiries in either period. |
| X = 0, Y above 0 | No enquiries, compared with Y before. |
| X above 0, Y = 0 | X enquiries, up from none. |
| X = Y | X enquiries, the same as before. |
| Y below 5 | Up or down from Y, with no percentage. |
| Y is 5 or more | Up or down from Y, plus a rounded percentage. |
Percentage = |X − Y| ÷ Y × 100.
5
Enquiries needed for a % change
25 pts
Agent share shift that gets flagged
The second sentence splits enquiries into direct buyers and agents acting for buyers. It only mentions the mix when the agent share moves 25 points or more, so small swings never get blown up into news.
06
Let's run it on the demo listing
- Count this period7 enquiries, 3 from direct buyers and 4 from agents.
- Count the previous period8 enquiries, 6 from direct buyers and 2 from agents.
- Apply the ruleY is 5 or more, so 1 ÷ 8 × 100 = 12.5% is printed, rounded to 13%.
- Check the mixAgent share went from 2 of 8 (25%) to 4 of 7 (57%), a 32-point rise.
Example data.
07
From being seen to being asked about
Most sellers ask me one thing: “How many calls did we get?” Fair question, but that number alone doesn't tell you why. The PropertyGuru panel adds the two steps before a call. If few people open your listing, we look at the photo or headline. If they open it but don't ask, we look at what they see after clicking.
The two rates
Open rate = listing opens ÷ times seen × 100. Enquiry rate = enquiries ÷ listing opens × 100.
11.6%
Open rate, latest two weeks
1.6%
Enquiry rate, latest two weeks
Example data. Viewings are not counted.
08
Eight weeks of example data
Over 56 days the example has 24 enquiries: 15 from direct buyers and 9 from agents. Week 7 had 4 enquiries, all from agents. Week 8 had 3, all from direct buyers. A two-week total would hide that change from you.
Example data.
The open rate stayed between 10.2% and 12.6%. The enquiry rate moved from 0.5% to 2.6%. On a real listing, that tells me people find it fine in search, and the question is what happens after they click.
Key takeaways
- Each period is compared with the one just before it, of the same length.
- You only see a percentage change when the previous period had at least 5 enquiries.
- Enquiries are split into direct buyers and agents, and a 25-point shift in the mix is flagged for you.
- The PropertyGuru panel shows how many people saw your listing, opened it and asked about it.
What the tool does not do
- It doesn't count viewings. I keep viewings and buyer feedback in my notes for you.
- It only shows what's in the records. A missing enquiry won't appear.
- All enquiry and view figures here are example data from a made-up listing.
FAQs
Can I use the seller dashboard for my own listing?
Only if you list your home with me. It reads the enquiry records and PropertyGuru analytics of my listings. The version on this website runs on made-up example data.
How is the previous period worked out?
It has the same number of days as the period you chose and ends the day before your start date. A 14-day update is compared with the 14 days just before it.
Can I see the phone numbers of people who enquired?
No. You'll see the name, date, channel and a mobile number with the last four digits replaced by asterisks. Full numbers stay in my agent-only panel.
Does the dashboard show how many viewings were held?
Not as a number. The data it reads has no viewing records. I write up viewings and buyer feedback for you in the notes section.
Sources (2)
- Ministry of National Development, written answer on complaints against property agents made to CEA (6 May 2019)
- Council for Estate Agencies, submit a complaint
For education and illustration only. Figures depend on the inputs and the rules in force at the time of writing, and property values can fall as well as rise. This is not financial advice.